Quantitative Thematic Maps
Based on quantifiable, empirical data, these were the first type of thematic maps to appear. They are often associated with the “hard” sciences, but some “softer,” statistically dependent disciplines, such as sociology and economics, have made significant use of them. Depending on the nature of the data and the audience for the map, only certain basic features of the underlying reference map are shown so that the thematic layer(s) is/are prominent.
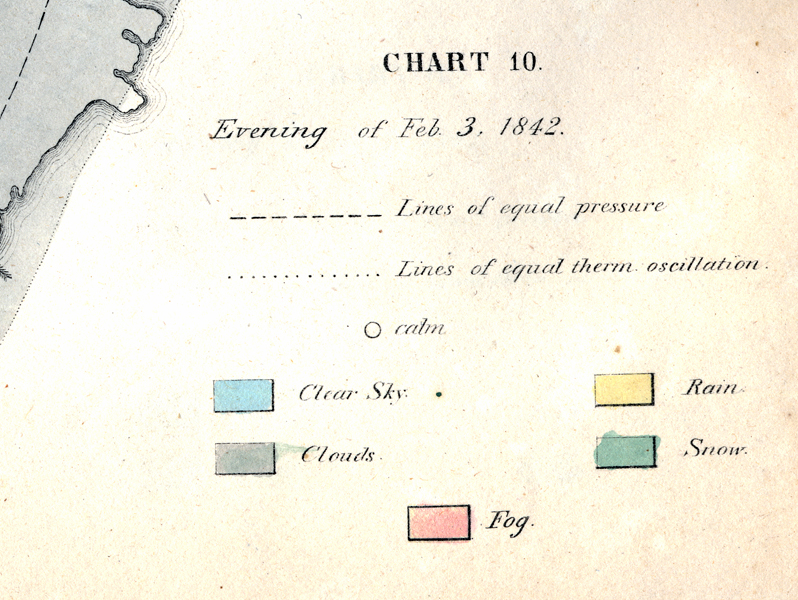
Key to Elias Loomis's "Chart 10" (1845)
